Dashboard
The Dashboard is the initial landing page when connecting to the webapp once a cluster has been created. It provides an overview of the status of each node in the cluster, along with system summary details. Operations such as stopping, starting and moving cluster services between nodes can also be instigated directly from the dashboard:
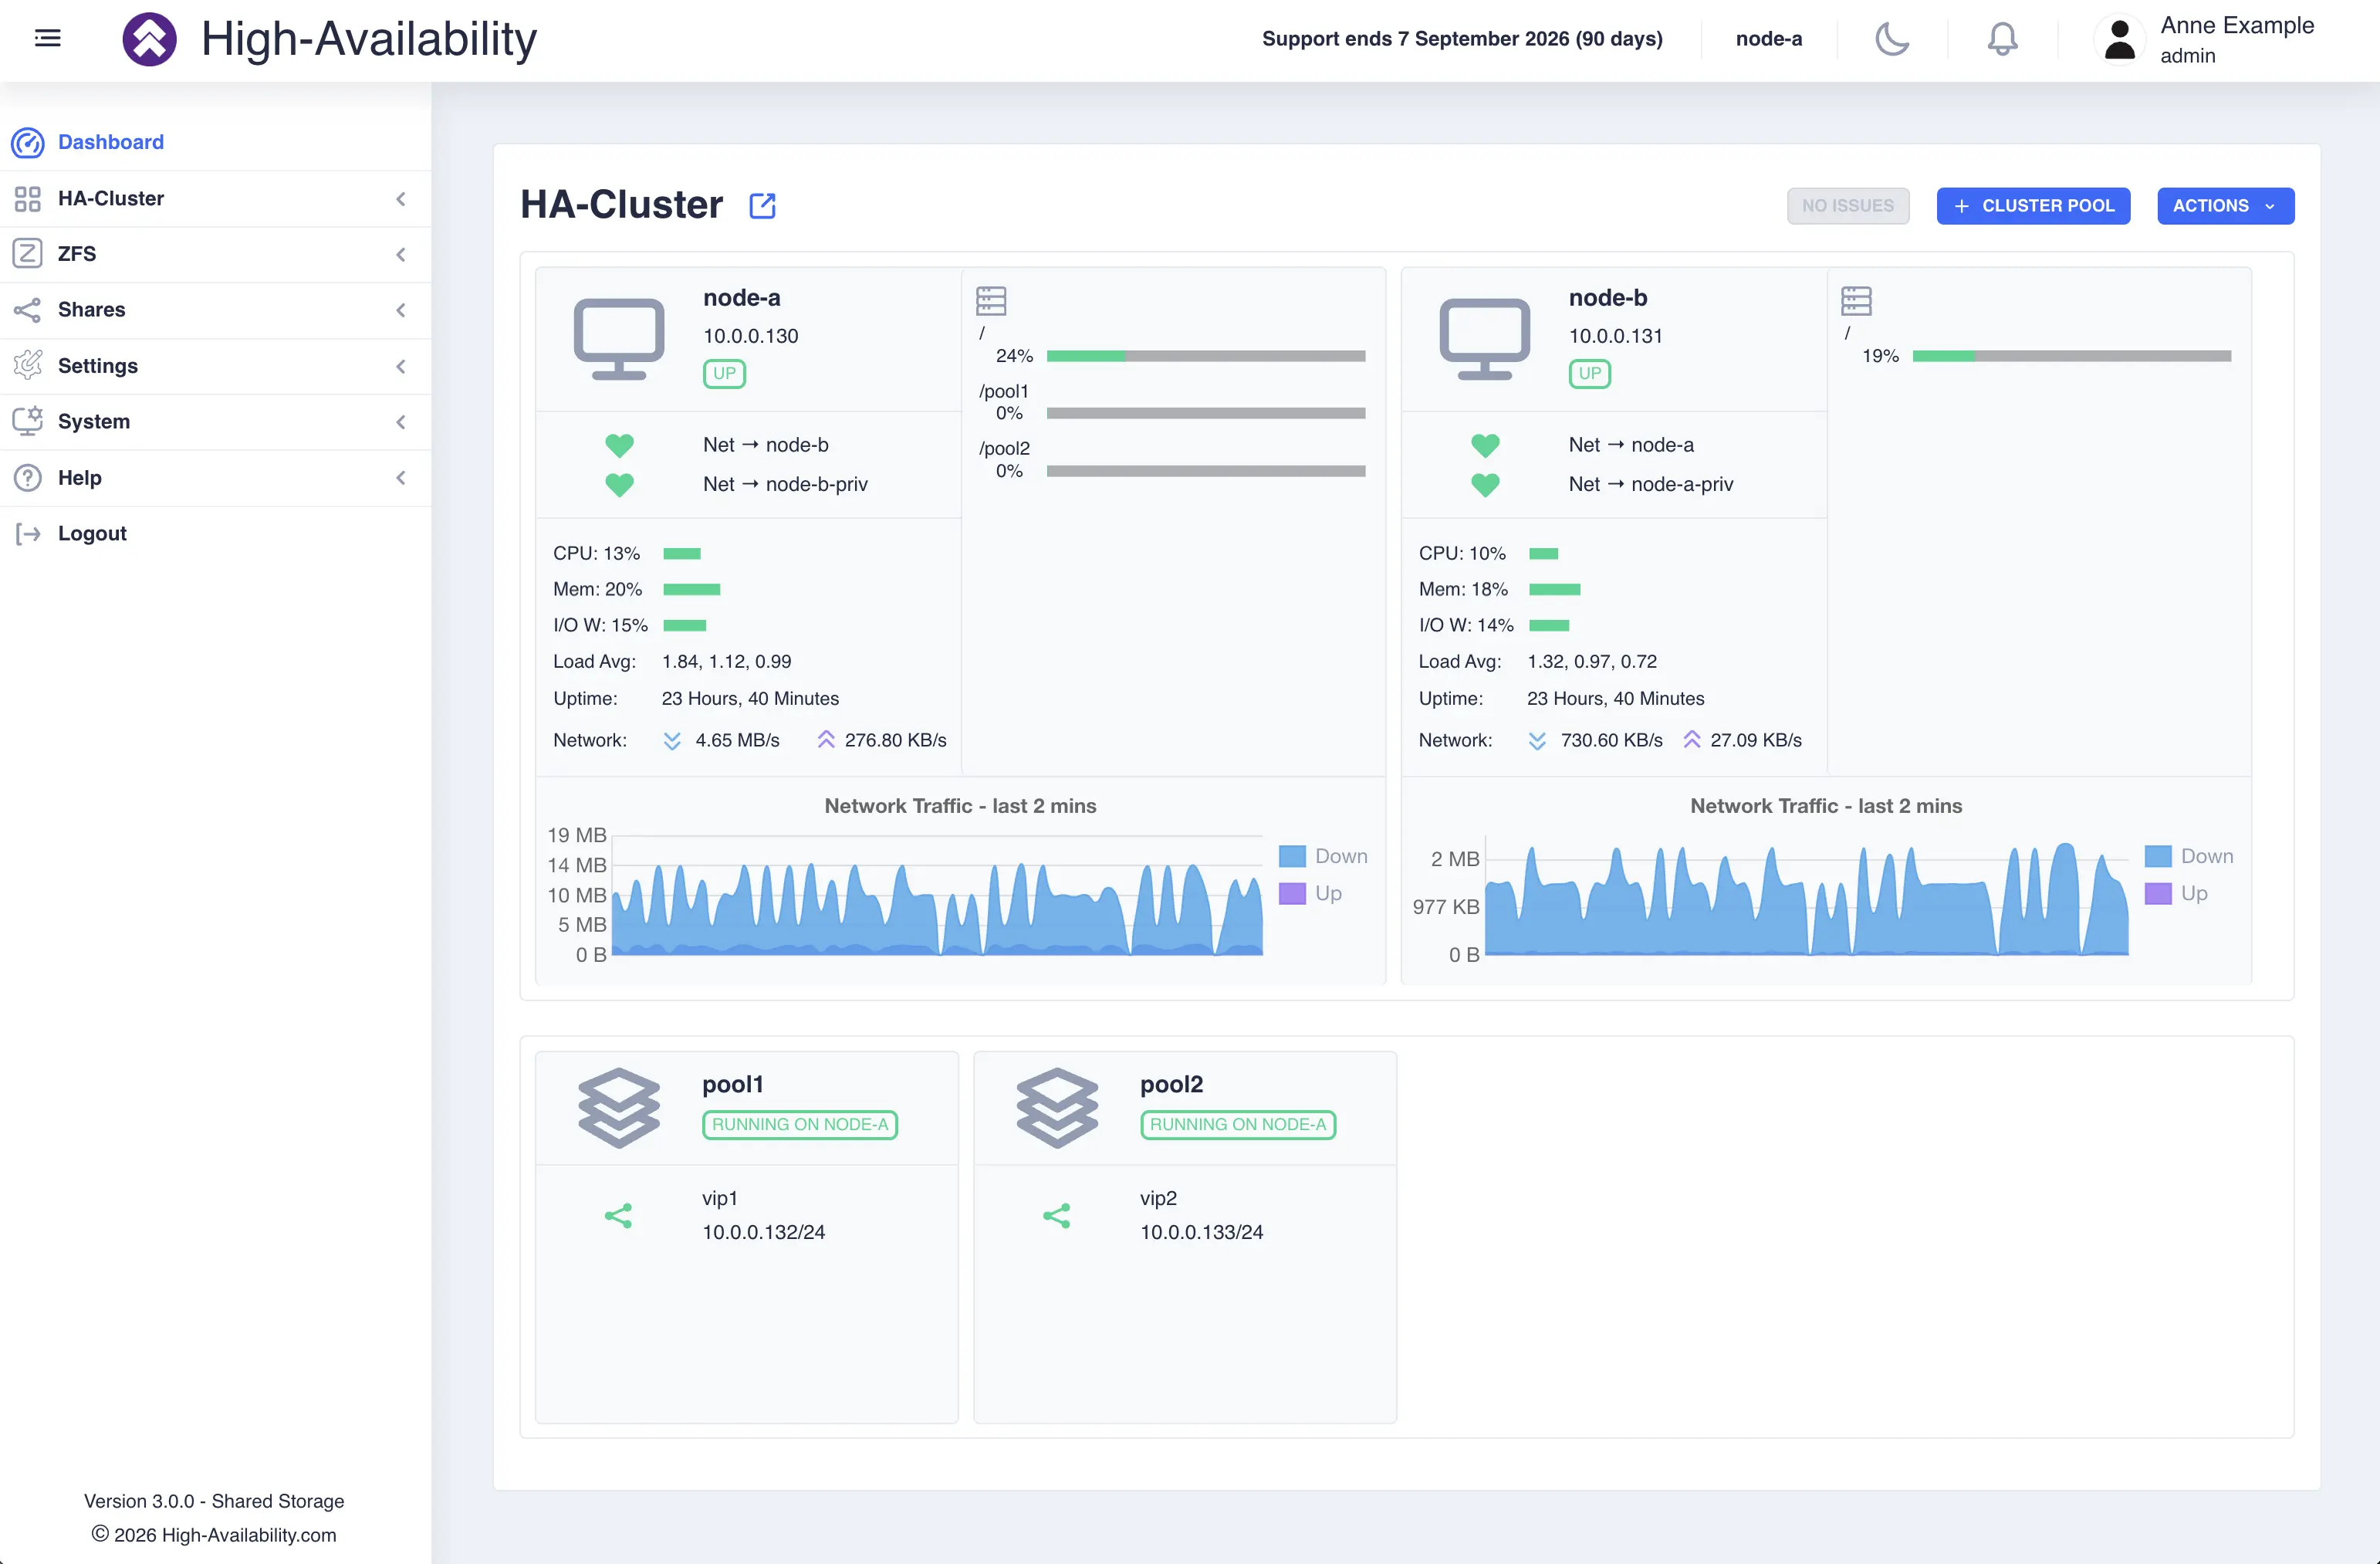
For shared nothing clusters synchronisation status is included in the service panel:
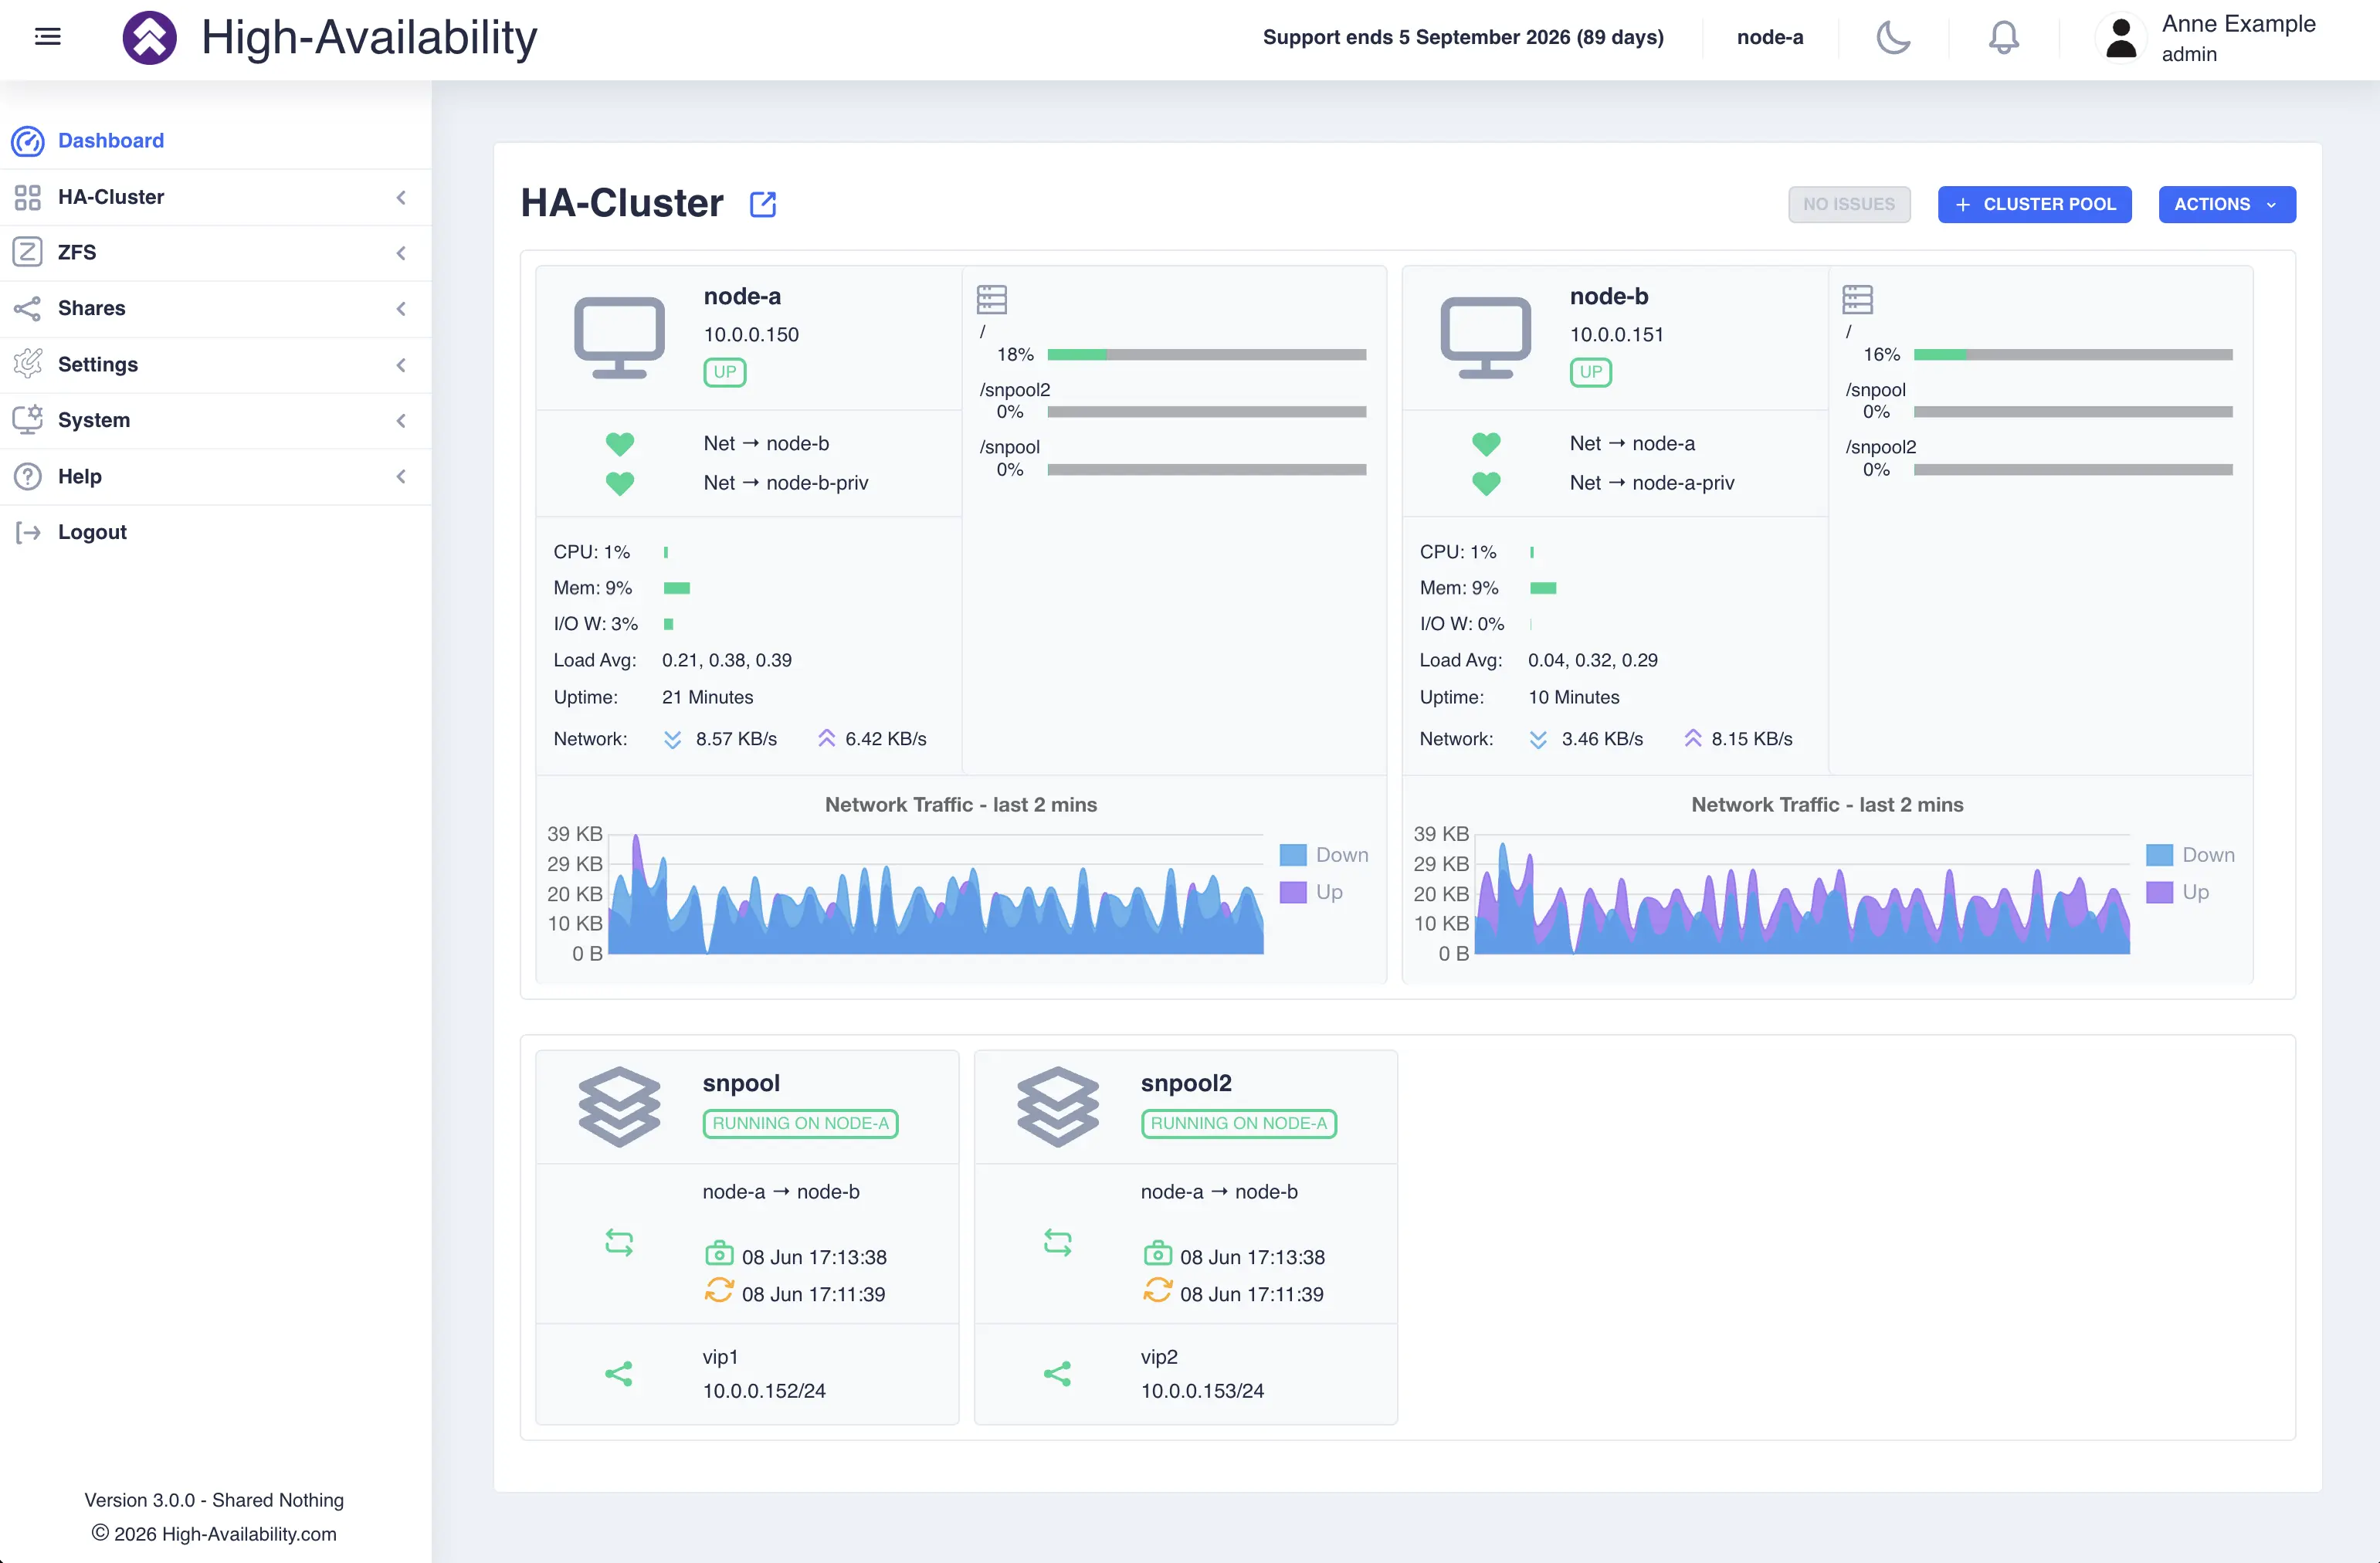
The dashboard is made up of two main panel types along with a navigation menu on the left hand side:
- A panel for each node in the cluster, detailing system and cluster information.
- A panel for each service in the cluster, detailing its status.
Each panel has a clickable area that brings up a context sensitive menu with additional information, described in the following sections.
Dashboard Buttons
The dashboard has a number of cluster related action buttons:

No Issues/Issues Button
Whenever issues are detected in the cluster, this button is enabled and launches a panel which provides more details; where possible an automated solution will be offered, otherwise the issues are detailed with the steps to resolve.
Issues are cleared automatically when they have been resolved.
Here is an example of a an issue with a shared nothing service, where the system crashed and once the server recovered the cluster software automatically locked replication so any unsynchronised data can be inspected and recovered if required:
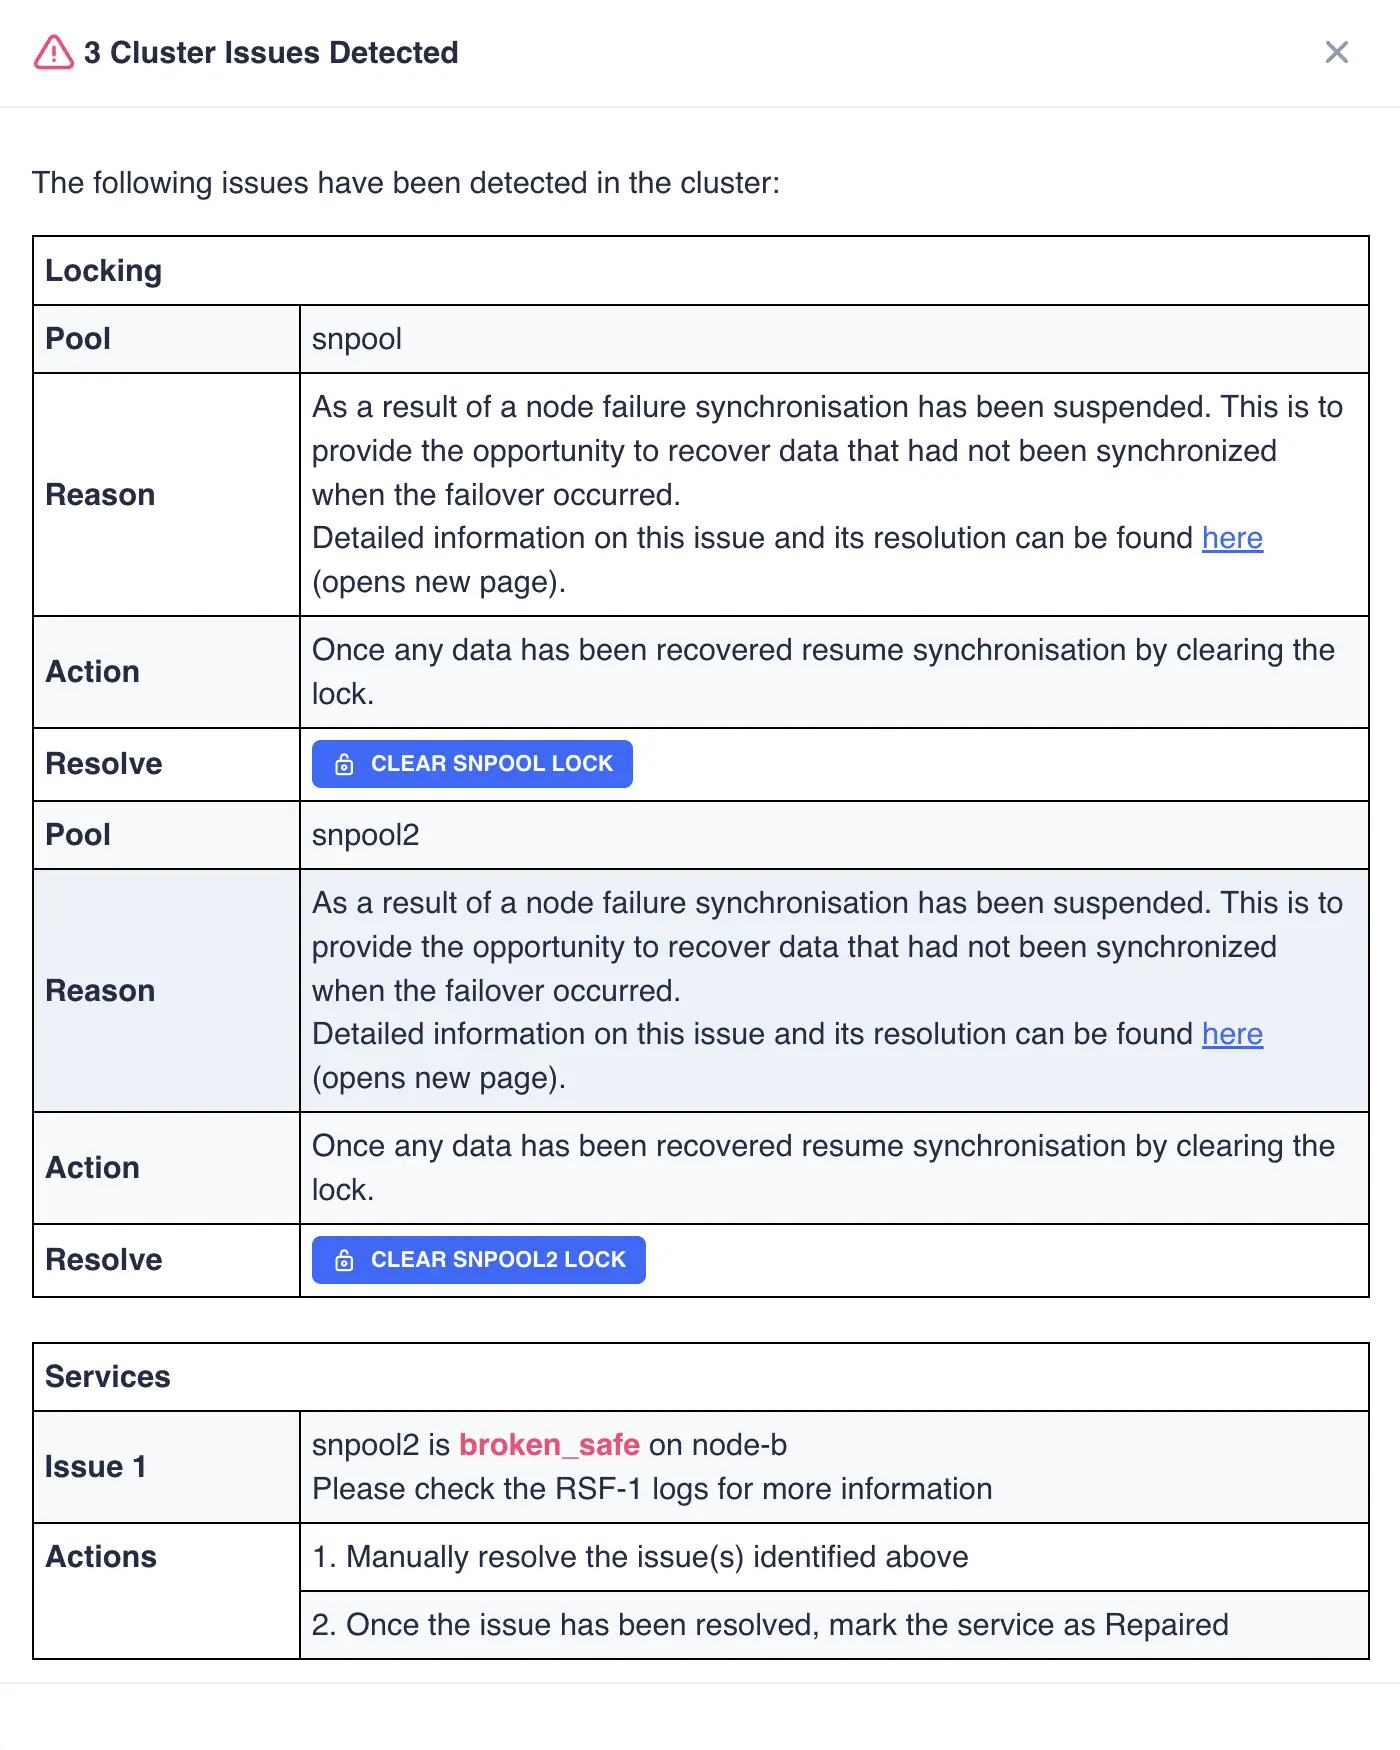
When ready to resume synchronisation the Resolve button can be clicked to resume cluster operations.
Cluster Pool Button
Navigates to the ZFS pools page where pools can be created, imported, exported and clustered.
Actions Menu
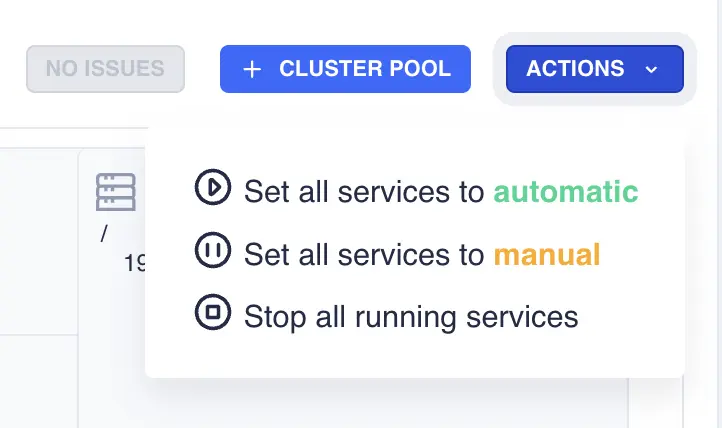
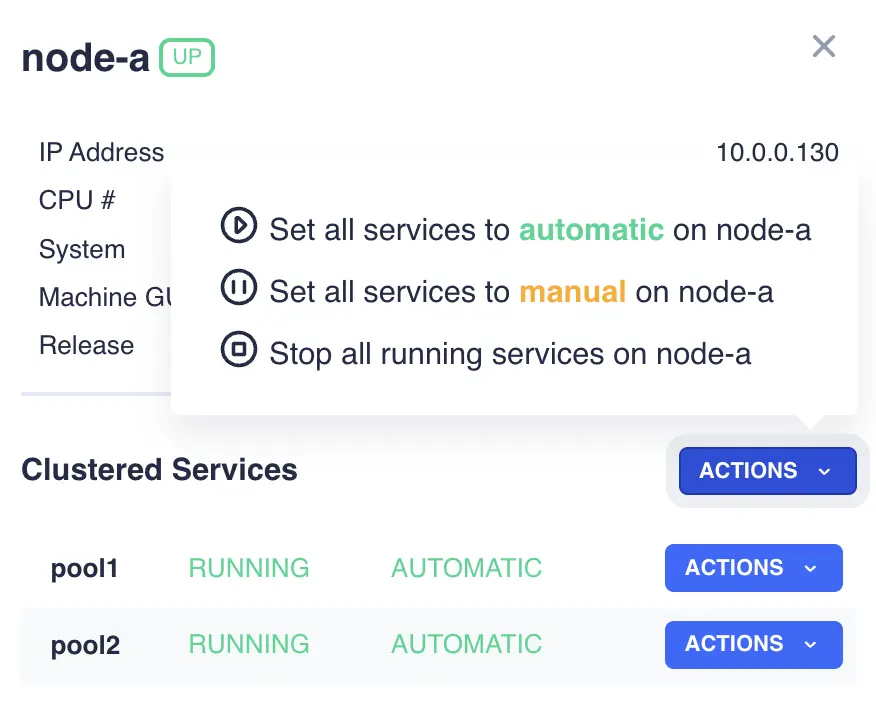
Performs actions that apply to all services in the cluster:
Node panel
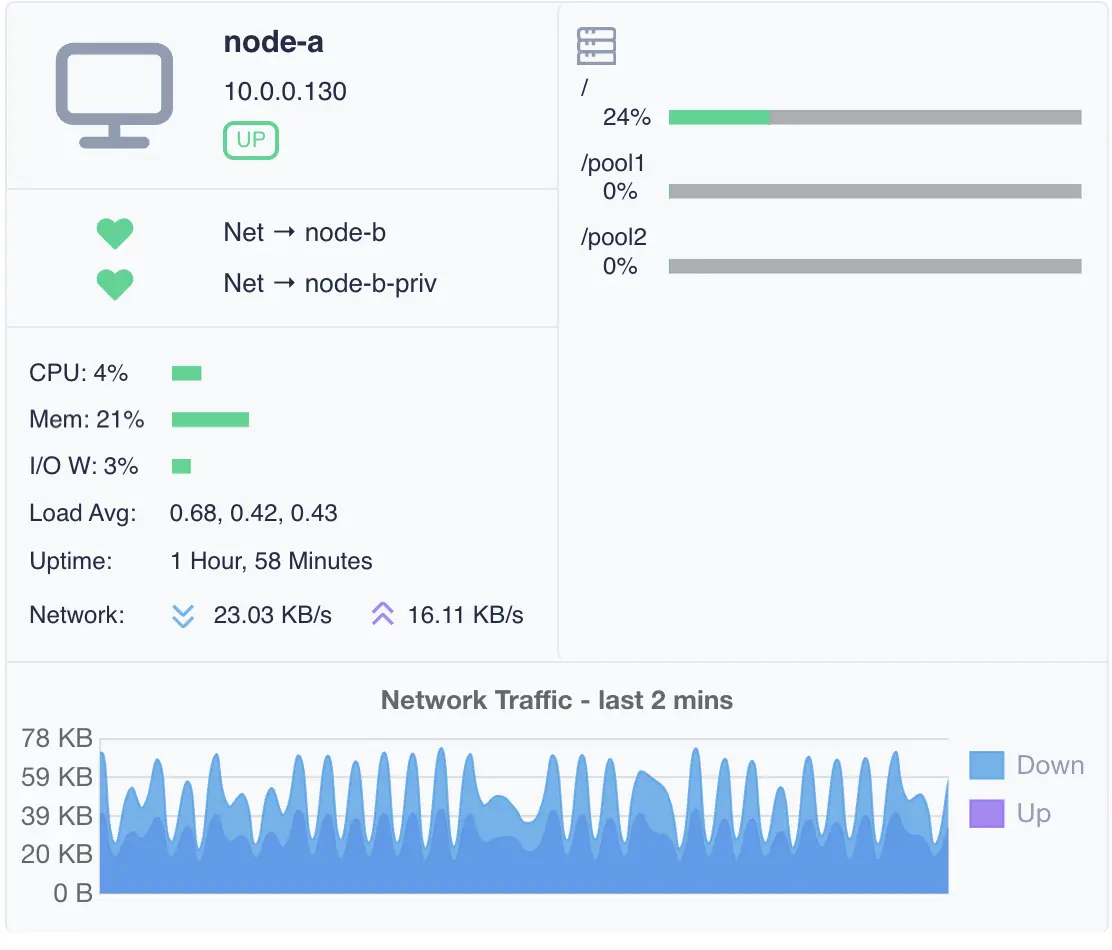
The nodes panel shows the status of each node in the cluster. Information is provided on cluster heartbeat status, CPU, memory and I/O wait delay, along with mounted filesystem status and a summary of the last two minutes of network activity for that node:
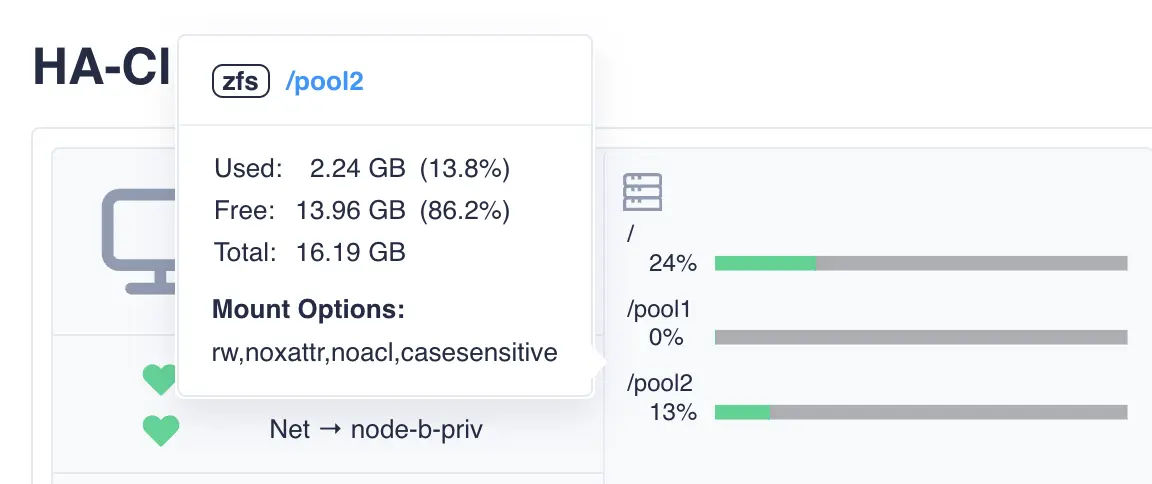
Hovering over any mounted filesystem on the node panel provides more detailed information:
Clicking on the node icon next to the node name opens a side menu that allows control of services known to that node. In the example above,
clicking on the icon for node-a brings up the following side menu, which includes system information details along with current memory
and swap usage:
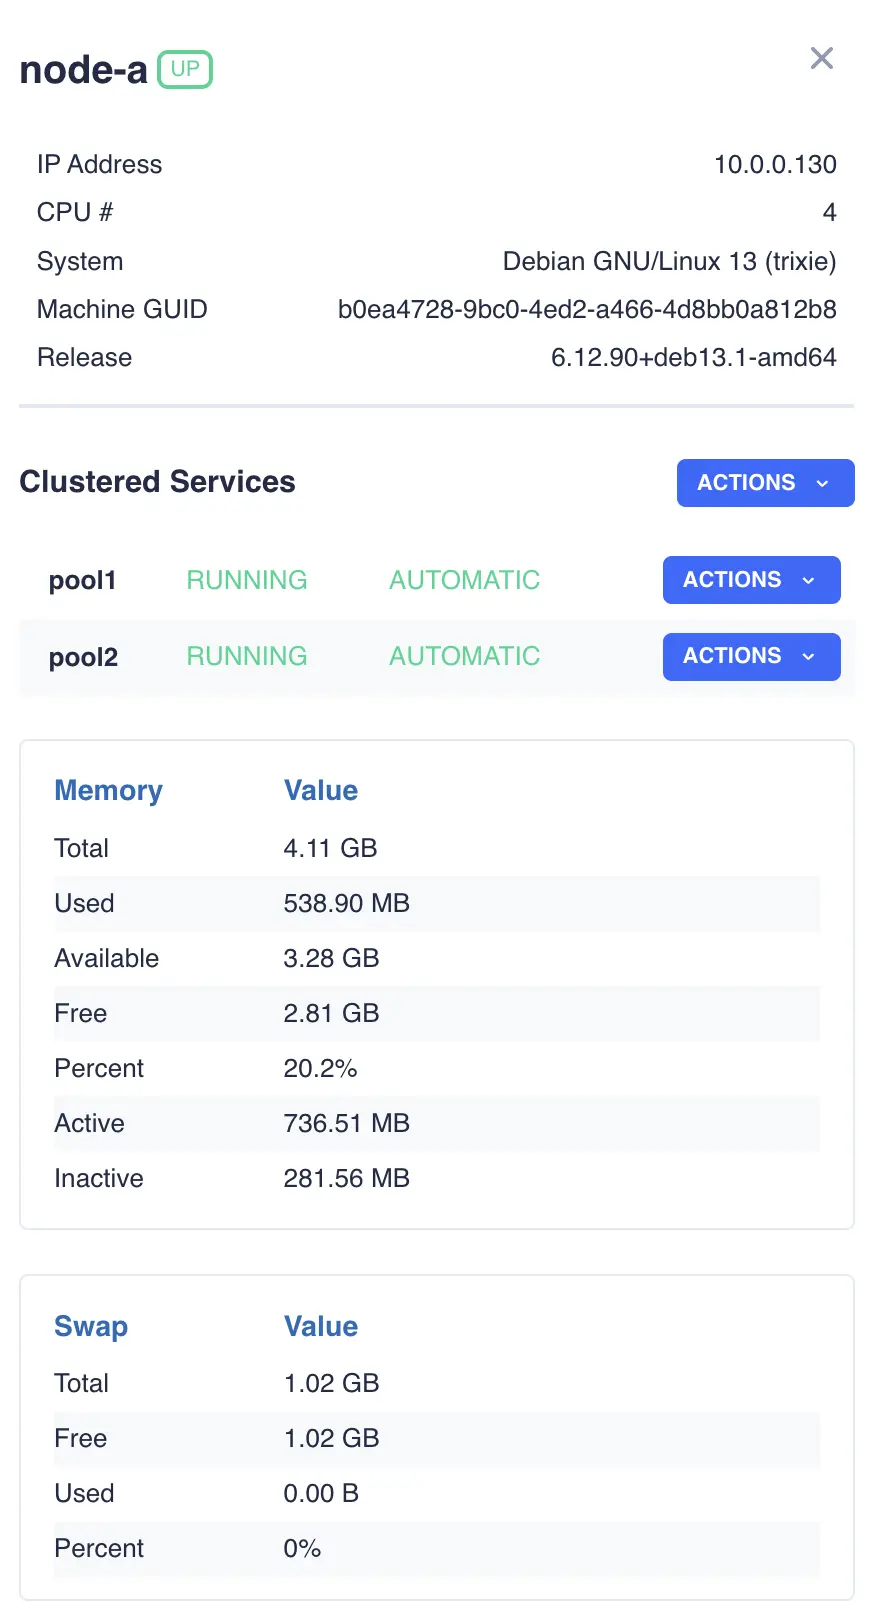
Available actions can then be viewed by clicking on the ACTIONS button in the right hand column for an individual service:
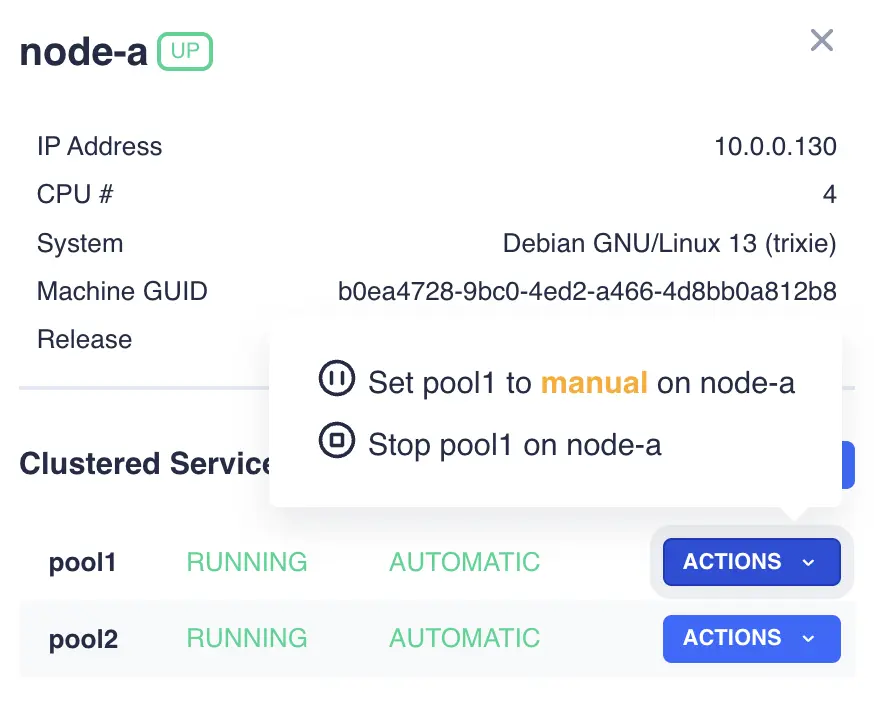
Alternatively, the ACTIONS button on the Clustered Services row brings up a menu that performs actions on all services on that node:
Services Panel
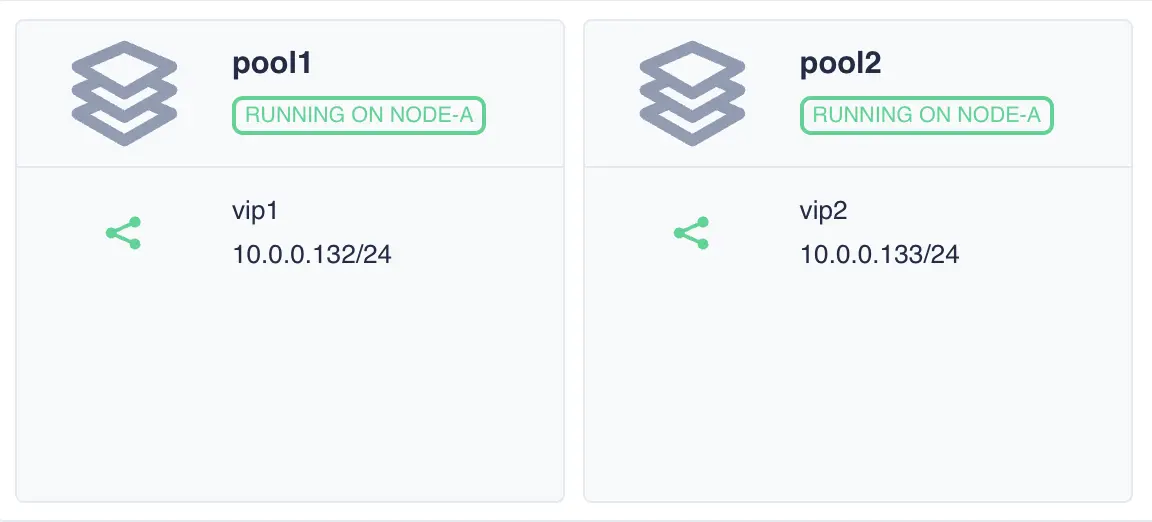
The services panel shows the status of each service in the cluster, for shared storage the panel consists of:
and for shared nothing:
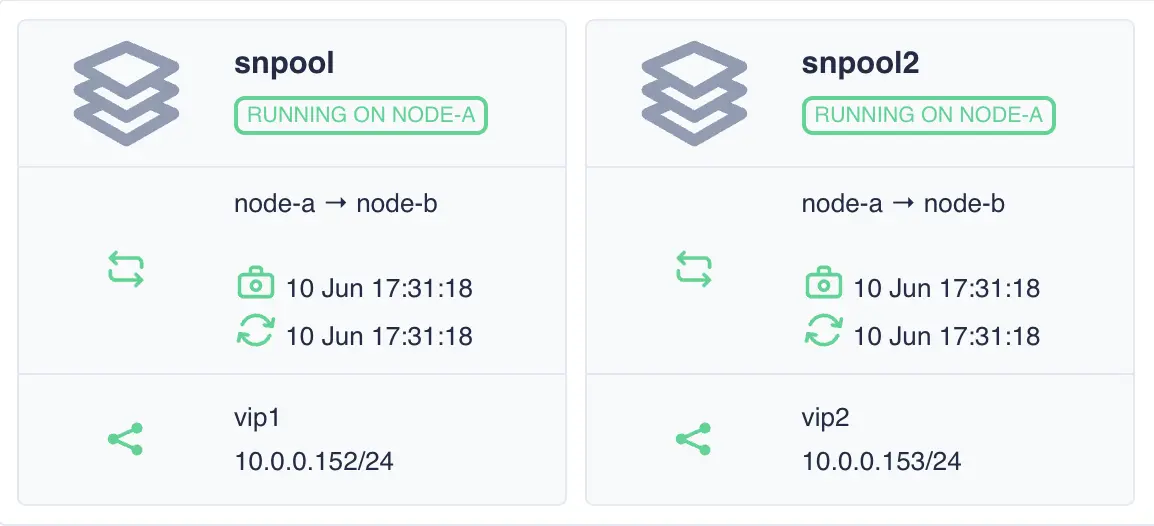
Each service panel details where a service is running and the VIPs associated with that service. Additionaly, for shared nothing clusters, a synchronisation status panel is also included.
New Services
When a service is added to an RSF-1 High Availability cluster, its state will initially be set to stopped / automatic
and the cluster will start the service on the services' preferred node.
The synchronization panel details the current state of the replication between the two cluster nodes:
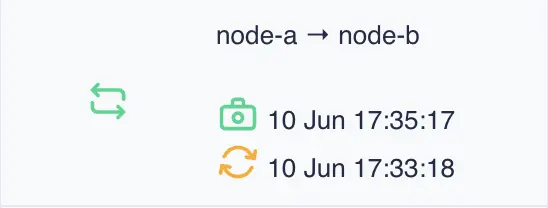
The information shown from top to bottom is:
- The direction of replication between nodes - in the above example data from
node-ais being replicated tonode-b. - The date of the last snapshot created on the active node.
- The date of the last replicated snapshot on the passive node. An orange icon indicates the passive node has yet to pull the latest snapshot.
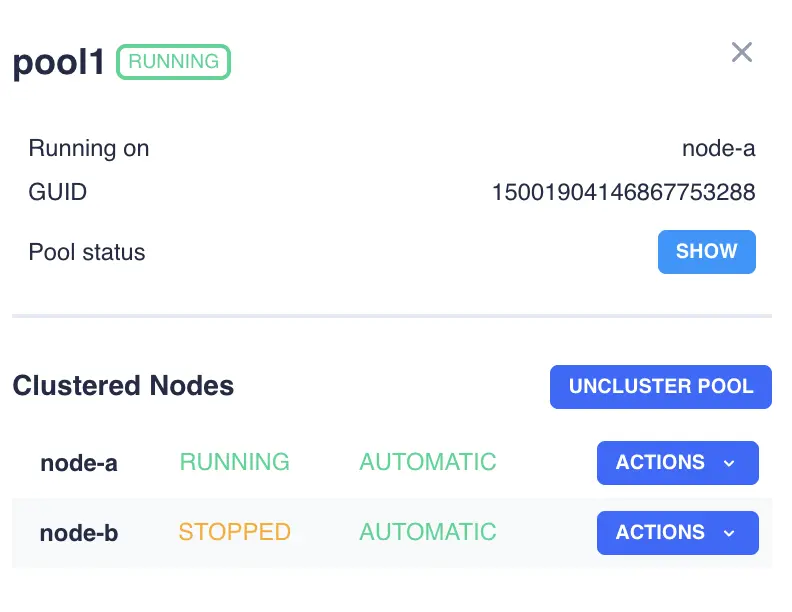
Clicking on an individual service opens up a side menu that allows control of that service in the cluster. In the example above
clicking on the icon for pool1 would bring up the following menu:
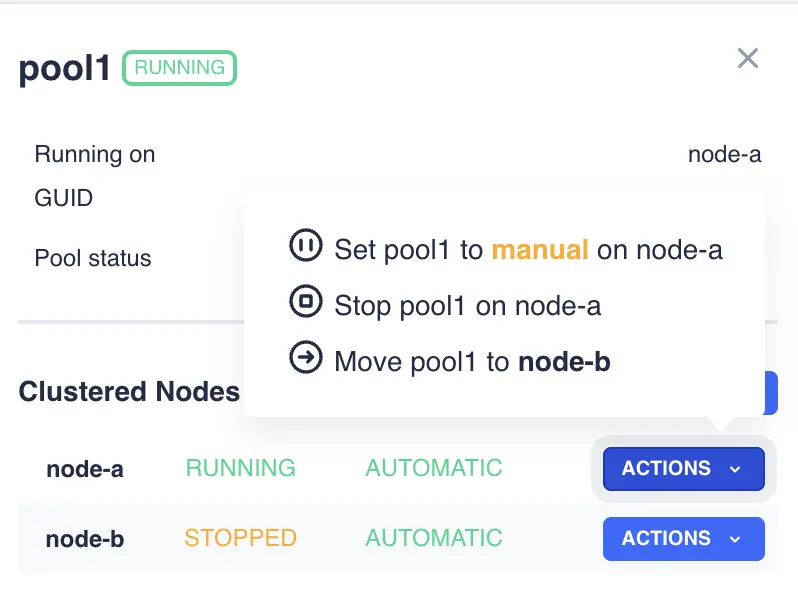
Available actions can then be viewed by clicking on the ACTIONS button in the right hand column for an individual service:
Clicking on the SHOW button brings up a window showing the pool status:
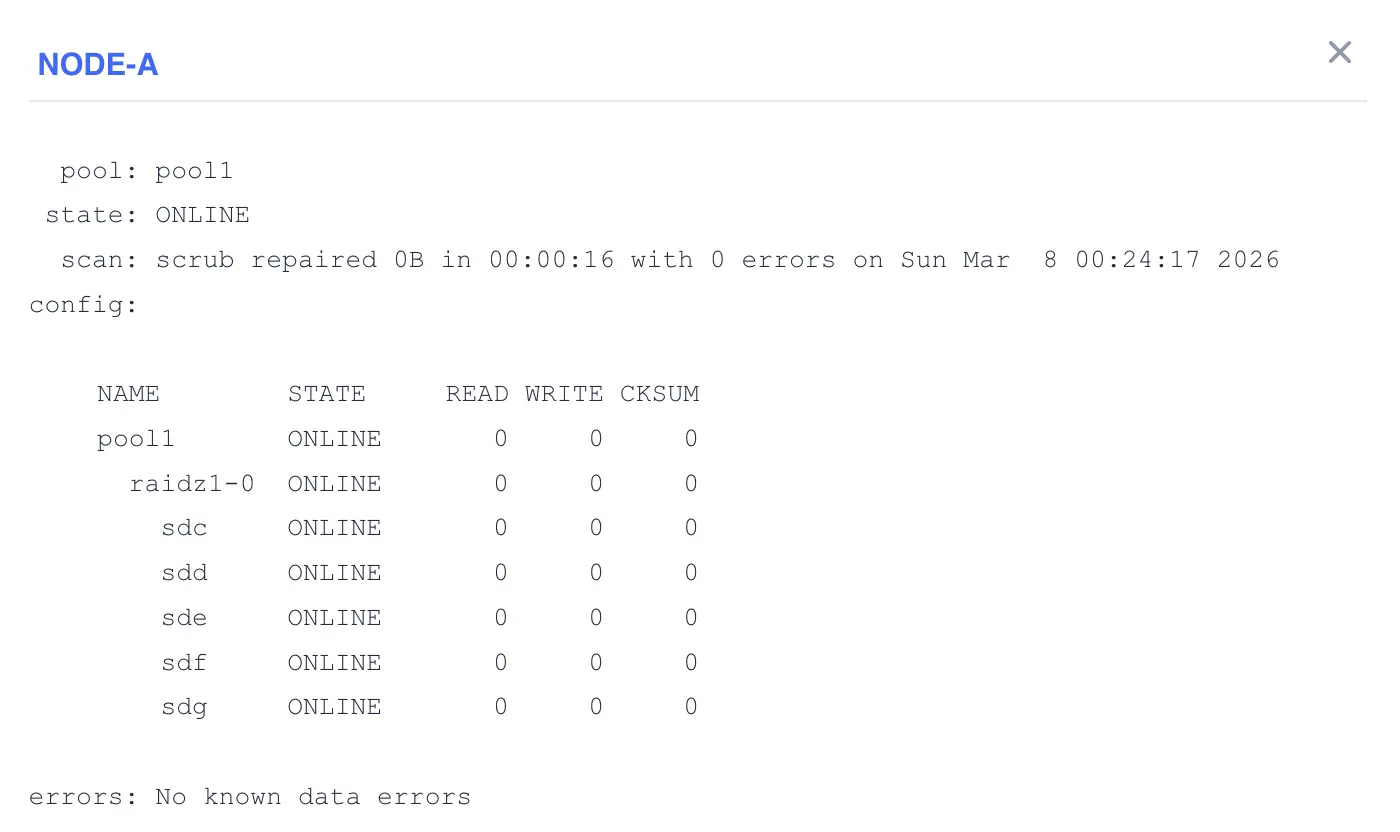
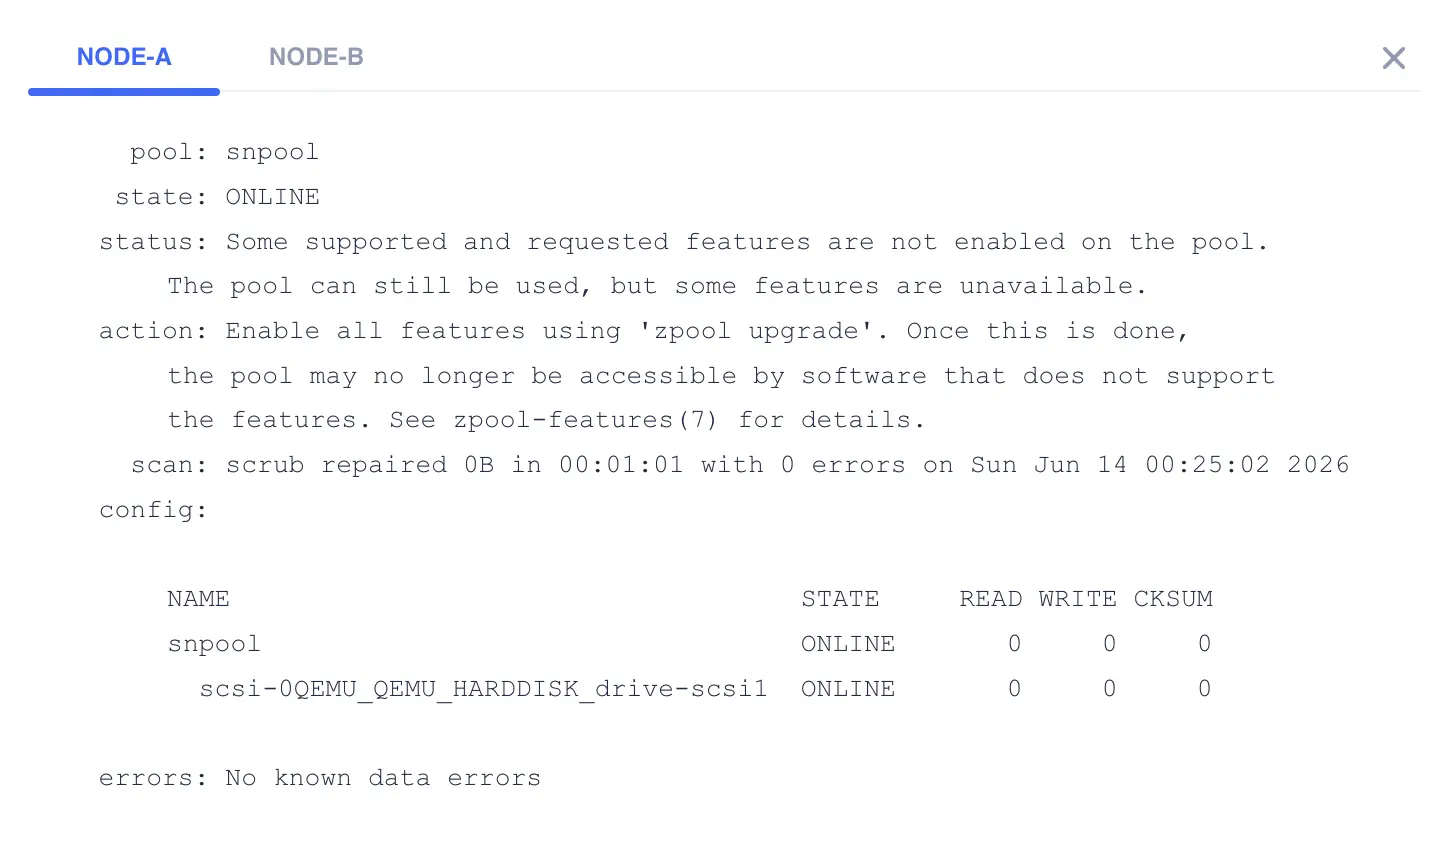
For shared nothing the pool status is shown for both nodes: